Asked & Answered 9.0
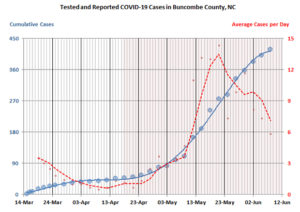
 We have been in isolation mode for the coronavirus for so long that maintaining distance in public has pretty much become an automated, fear-induced behavior. This is sad. Like everyone else, I want to get out and go to restaurants and live life normally, but the case numbers here have not been encouraging. I have been keeping a chart (at right) which shows we are averaging 7 new positive tests a day.
Is there some “magic number” of new cases per day that would make me feel comfortable increasing my degree of exposure to the world? There must be some number, otherwise it wouldn’t be worth my while tracking this data. So, how do I translate the rate of positive test results in my area to my personal risk level of going out and about?
Having found no clear answer to this on the internet, I thought I would play Dr. Fauci and guesstimate it myself, given the data available to me, plus some assumptions. Here goes.
• • •
At its most basic level, the formula may be expressed as chance of infection per contact = chance the other person is infected times chance of transmission upon contact.
Let’s start with the chance that the contacted person is infected. Here I define contact as passing through a person’s airspace for some length of time. I will ignore transmission via objects for now, as I use gloves, hand-washing and object-cleaning protocols to minimize that risk factor — for me.
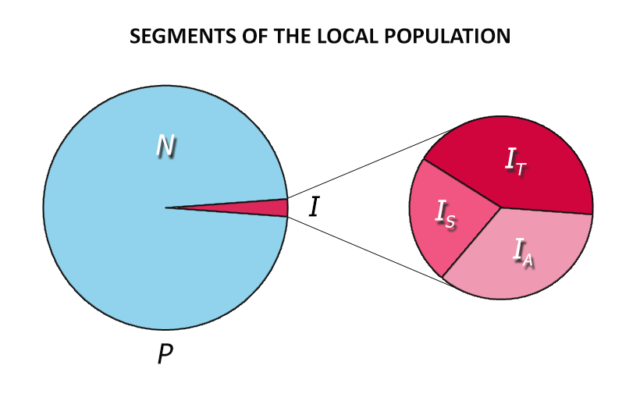
My chance of contacting an infected person on a given outing depends on the number of contacts I make and the percentage of infected people among them. This is a good place to introduce my framework and assumptions, starting with the chart below:
 My first assumption is that I only come in contact with the local population (P), defined as those who live in my county. This population consists of two groups, those infected with the virus (I) and those not infected (N). The infected group is further divided into three sub-groups: asymptomatic (IA); symptomatic but untested (IS); and those who have tested positive (IT) and are considered contagious. Those who test negative and those who have recovered from the virus are included in group N.
For our purposes, I assume that infected people are evenly distributed around the county and may travel anywhere within its borders. Whether I meet an infected person depends on their propensity to travel, which may differ among the various sub-groups. If we define the baseline (i.e., non-infected group) propensity to travel as fN = 1.0, then we can assign (by guesswork) travel factors fA , fS and fT to the infected sub-groups, where each f-factor is between 0 and 1. For instance, we might suppose that those who have tested positive and are still contagious would have a low propensity to travel — so fT might be 0.1, say.
This framework leads to Equation 1, the chance CI that a random contact is infected:
(1) CI = ( fA IA + fS IS + fT IT ) / P
Now, we know P, and county health officials provide a weekly update on the number of positive tests, but that’s about all we know. We have to deduce the sizes of the sub-groups IA, IS and IT and the travel factors fA , fS and fT using official estimates and semi-informed guesswork. Let’s consider each of these in turn.
First, we estimate the number of people in the IT (tested positive) group as IT = d Q , where d is the duration of a typical infection (also the quarantine time following a positive test) and Q is the rate of new positive test results per day. We assume that the positive test rate is at steady-state, i.e., Q is constant. For simplicity, we also assume that those who test positive are tested on the first day of their infections. So, if Q = 10 new positive test results per day and d = 21 days, then the number of people currently in the IT sub-group is 210.
But there are plenty of stories about symptomatic people who do not bother to get tested and who only slightly modify their behaviors (the IS sub-group). I have found few clues as to the size of this group, and none of the testing statistics are relevant. The best I can do is take a wild guess at the fraction of infected people who develop symptoms but go untested. Based on human nature (see hurricanes), I would bet that at least a third of symptomatic people “ride it out” without ever seeking care or getting tested, at least in this county.
So the size of the symptomatic group IS = kS ( IS + IT ), where kS is the fraction of those symptomatic and infected who go untested. This may be rearranged as IS = IT kS / (1 – kS ).
Finally, the infected-but-asymptomatic group IA . There has been much debate about how many infected people are asymptomatic and how infectious they are. The CDC estimates that 35 percent of infected people are asymptomatic — I have seen figures as high as 80%. For our purposes, we will assume that asymptomatic people also never get tested, and that their propensity to travel is the same as the non-infected group.
The relevant formula here is IA = ( IS + IT ) kA / (1 – kA ), where kA is the fraction of infected people who are asymptomatic.
Given all the above, we are now ready to plug some numbers, guesses and estimates into our equations:
- Local population (P) = 262,000
- Local positive test rate (Q) = 7 positive results/day, where we live, as of now
- Average duration of infection (d) = 21 days, more or less
- Fraction of symptomatic infected people who go untested (kS ) = 0.33 (?)
- Fraction of infected people who are asymptomatic (kA ) = 0.35 (per CDC)
- Relative propensity of asymptomatic-infected people to travel (fA ) = 1.0
- Relative propensity of symptomatic-infected people to travel (fS ) = 0.7 (?)
- Relative propensity of tested-positive people to travel (fT ) = 0.1 (?)
This works out to 147 tested-positive people (IT ), 72 symptomatic-infected people (IS ) and 118 asymptomatic-infected people (IA ) in my county at the moment. So the chance CI that an individual contact is infected, given my assumptions, is…
One of every 1427 contacts.
This is equivalent to selecting one American at random and finding out that she lives in Boise, Idaho.
Extending this scenario, if I were to contact 10 people during an outing here, the chance that at least one of those contacts is infected would be about 1 in 140. This is roughly the odds of drawing a straight or better in a five-card poker hand.
What about large gatherings, say, a restaurant with 50 patrons? According to my model, the odds in my county that at least one of them is infected would be about 15 to 1. So, this gives you a sense of how the risk increases with the number of contacts one makes.
• • •
 But contact is not the same as transmission. The likelihood of transmission depends on the degree of exposure (i.e., how much virus is being released) and the time of exposure, as well as the overall effectiveness of masks, distancing and the like. We can quantify this via the transmission factor τ = 1 – (1-x) t where x is the transmission risk per minute of exposure and t is the length of exposure in minutes. (The chart at right shows τ vs time for x = 0.4). τ = 1 represents 100% certainty of virus transmission during a given contact.
As with propensity to travel, the different infected subgroups may vary in their ability to infect others. For example. asymptomatic victims are thought to shed less virus than those who are coughing and sneezing. On the other hand, knowing that one is interacting with a positive-test victim may lead both parties to take more precautions. So, the x factors could look something like this in practice:
- Transmission risk per minute, asymptomatic-infected people (xA ) = 0.1 (?)
- Transmission risk per minute, untested symptomatic-infected people (xS ) = 0.3 (?)
- Transmission risk per minute, tested-positive people (xT ) = 0.2 (?)
These guesswork values imply, for instance, that 5 minutes of contact with a symptomatic untested victim is 83% certain to lead to transmission in our current personal-protection environment. Is this true? I have no idea. But again, by building a model and plugging in numbers that sound sort of reasonable, one can at least get an order-of-magnitude sense of the risk.
So, adding transmission risk to Equation 1 produces the model in Equation 2, where CX is the chance of transmission from a random contact:
(2) CX = (τA fA IA + τS fS IS + τT fT IT ) / P
And, the chance of transmission C from an outing with n random contacts (assuming the same exposure time for each) is then…
(3) C (n) = 1 - (1 - CX ) n
Here then is a chart summarizing my estimated odds of being infected from an outing in my county at the current time, given n random contacts and exposure time t per contact (plus all the other assumptions above):
 These are admittedly rough estimates, but the salient point here is that these odds are not a million-to-one, but nor are they three-to-one. If they were either, one’s rational response would be much clearer. As it is, these figures call for deliberation, which we have not been given much opportunity to do — health officials are naturally reluctant to express our risks this way. Epidemiologists are not paid to make back-of-the-envelope calculations — that’s why I had to do it.
• • •
Now, if you’re not happy with my figures, you can play Dr. Fauci yourself. I have created a risk calculator that will let you enter figures for your own location and estimate your odds of becoming infected. And you can change all the parameters of the model as you see fit. The odds are updated instantly when you change one of the entries.
If you play around with the calculator a bit, you will see how the odds depend heavily on the assumed fraction of infected people who are asymptomatic (kA). The more people who are out and about, unaware that they are infected but still able to infect others, the greater your risk of becoming infected during an outing.*
Now it’s time for the disclaimers. I remind readers that this is a static model, a snapshot of a person’s contact risk given the current local rate of new cases and enough assumptions to fill an F-150 pickup. It is not a dynamic model — it does not predict trends and it does not take the weekly rise and fall in local rates into account. It is obvious from my model, however, that if one wants to lessen her risk of infection, she should make fewer outings, limit her number of contacts and the time she spends with them, and adopt measures to minimize the risk of transmission when exposed to those contacts.
But what if the odds are 1000:1? Well, it will be Person #1000 who takes that chance and does his part to keep the pandemic alive.
Which is what responsible health officials have been telling us all along.
Addendum
I ran some numbers for the Tulsa, Oklahoma, Trump rally scheduled for June 20, 2020. Tulsa County has 620,000 residents and its daily new case rate is 120 per day and rising. After adjusting some of my figures, given that attendees will be temperature-checked and the more symptomatic may be turned away, I still come up with odds of transmission of about 44:1. I assume that each attendee will share an airspace for 60 minutes with his 8 nearest neighbors. If 19,000 people attend, then about 430 cases, and perhaps 5 deaths, may stem from the rally. “A very small percentage,” Trump said. He doesn’t care.
______________________


Jeepers, Craig! Maybe Chemical Engineers had always needed to learn how to apply statistical models, but Chemists of my generation never did so: thank goodness that statistics have been required aspects of chemistry curricula for lo these many years.
I trust your data, equations and output. I’ve recently gone with my gut and decided to fly out to Kentucky to visit my son in early July, after many postponements . . .
I will not go into a restaurant and will not get on a plane for the foreseeable future. I go to Costco because everyone must wear a mask plus I can go during over age 60 hours.
The major factor from what I have read is time of exposure. Both of the above have too much of that.
Listen up Macarthur Foundation! This post deserves a genius award!!!
He thinks that he cannot change the world. I think that he can. Craig amazes me everyday. I love living with his humor and brilliance.
Hear, hear! I would love for this particular post to be published as a stand-alone paper and posted to SSRN (the social science research network). Also, I would love Craig’s “thoughts at large” to be compiled in a book and published by a top-notch publisher!
Thank you Enrique… I have privately thought about compiling a “best of” Thoughts@Large booklet and somehow self-publishing it but, who would buy it?